[bsa_pro_ad_space id=14]
What happened over the first quarterly period of 2019? Read all about it here.
New vehicle sales in Australia over the first quarter of 2019 fell 7.9% relative to the same period in 2018, to 265,538 units.
This is the lowest Q1 tally since 2014, and marks 12 consecutive months of negative growth compared to the same month in the preceding year.
This data comes from VFACTS, a sales record compiled by the Federal Chamber of Automotive Industries, based on sales figures submitted by each of the market’s car brands. While not flawless, it’s the best we have.
March sales wrap: VFACTS: Lowest March sales since 2014
Regions:
The two biggest State economies are dragging the chain disproportionately. Victoria’s new vehicle sales have fallen 10.5% (equal to 9008 fewer units sold YTD over Q1, 2018) despite a purported strong economy there, while New South Wales sales fell 9.2% (8704 sales).
Queensland (down 5.9%, equal to 3374 units), Western Australia (down 5.8%, 1425), the Australian Capital Territory (down 10.3%, 509) and Northern Territory (down 1.4%, 36 units) are also down.
South Australia (up 0.2% or 41 units) and Tasmania (up 0.3% or 15 units) alone bucked the trend. Indeed, treading water as they have is in reality a bigger gain that it seems considering the overall market situation.

Type of sales:
Sales to private/personal buyers sit at 127,213 for Q1 this year, down 8.6%. Business or ABN-linked sales were down 9.8% to 109,188.
Rental car sales actually grew 5.3% to 14,492, while sales to government agencies and departments grew 3.4% to 9327.
Sales by segments:
Vehicles classified as SUVs dominated the market over Q1, with 118,892 sales equal to 44.3% market share. Passenger cars (those neither classified as SUVs or light commercial vans/utes) tallied 84,200 units, equal to 31.4% share. Light commercials 21.3%, 57,128.
Breaking it down further, the top-performing vehicle sub-segments by market share over Q1 included: Medium SUV (18.3% of the total market), Small Car (16.1%), 4×4 Ute (15.9%), Small SUV (12.7%) and Large SUV (11.6%).
That means these top 5 segments accounted for 74.6% of all new vehicles sold.

Sales by fuel type:
Passenger vehicles were 91.3% petrol-powered, 5.2% petrol-electric hybrid and 3.2% diesel. The remaining fraction were EVs and PHEVs, but this figure is undercooked since Tesla refuses to disclose it sales.
SUVs were 74.2% petrol, 25% diesel and the remaining fractions hybrid, PHEV and EV. This will shift once the Toyota RAV4 hybrid launches, given Toyota expects to sell around 8000 annually at least.
Light commercial utes and vans were 93.6 diesel and the rest petrol.
Sales by origin:
Our top sources of imports over Q1, 2019 were: Japan (85,171, down 5%), Thailand (72,232, down 7.1%), Korea (36,295, down 15.5%), Germany (21,428, down 8%), the USA (9617, down 10.8%), and England (7629, down 10.5%).

Top models by key segments:
Micro Car: Kia Picanto (1447), Fiat 50/Abarth 595 (250), Mitsubishi Mirage (143)
Light Car: Hyundai Accent (3409), Mazda 2 (2771), Toyota Yaris (2338)
Small Car: Mazda 3 (8128), Toyota Corolla (6986), Hyundai i30 (6222)
Small Car ‘Premium’: Mercedes-Benz A-Class (1224), Audi A3 (995), BMW 1 Series (545)
Medium Car: Toyota Camry (3791), Mazda 6 (810), Subaru Liberty (298)
Medium Car ‘Premium’: Mercedes-Benz C-Class (2094), BMW 3 Series (582), Mercedes-Benz CLA (392)
Large Car: Holden Commodore (1402), Kia Stinger (453), Skoda Superb (226)
Large Car ‘Premium’: Mercedes-Benz E-Class (385), BMW 5 Series (371), Mercedes-Benz CLS (72)
People Movers: Kia Carnival (1777), Honda Odyssey (461), Volkswagen Multivan (227)
Sports Cars: Ford Mustang (1303), Mercedes-Benz C-Class (610), BMW 2 Series (266)

Small SUV: Mitsubishi ASX (6176), Mazda CX-3 (3737), Honda HR-V (3259)
Small SUV ‘Premium’: Volvo XC40 (781), BMW X1 (613), Mercedes-Benz GLA (595)
Medium SUV: Mazda CX-5 (7118), Mitsubishi Outlander (4905), Toyota RAV4 (4855)
Medium SUV ‘Premium’: BMW X3/4 (1721), Mercedes-Benz GLC (1473), Audi Q5 (936)
Large SUV: Toyota Prado (4584), Toyota Kluger (2799), Mitsubishi Pajero Sport (2220)
Large SUV ‘Premium’: BMW X5/6: (901), Range Rover Sport (769), Porsche Cayenne (407)
Upper Large SUV: Toyota LandCruiser (3359), Nissan Patrol (533), Mercedes-Benz GLS (128)
Vans: Toyota HiAce (1340), Hyundai iLoad (987), Renault Trafic (499)
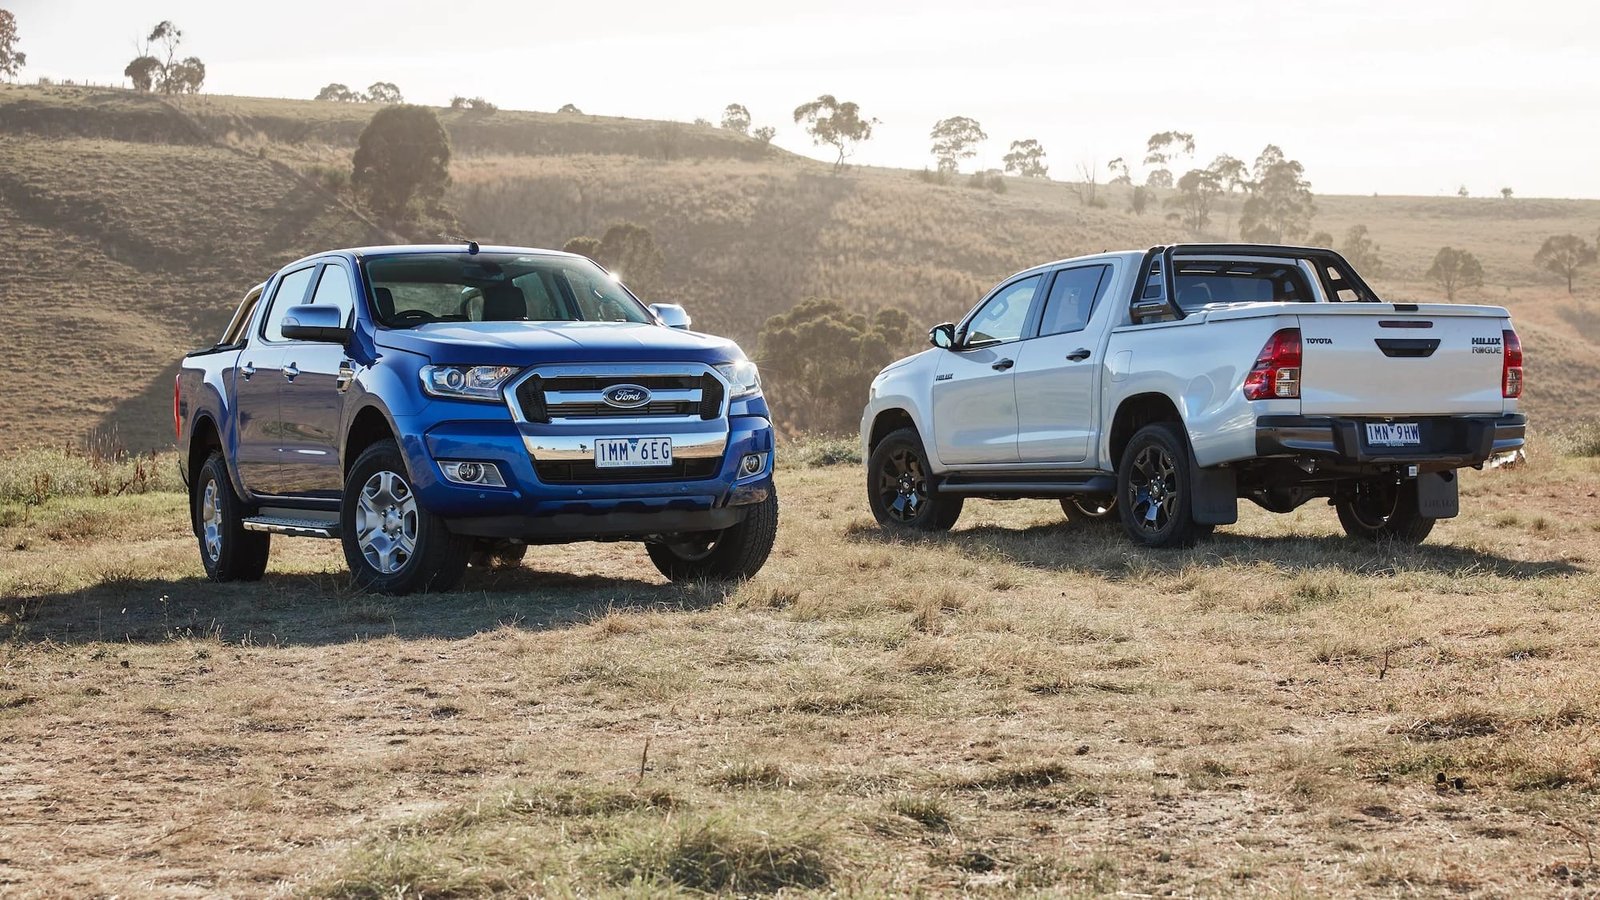
4×2 Ute: Toyota HiLux (3123), Ford Ranger (1141), Isuzu D-Max (1121)
4×4 Ute: Toyota HiLux (9786), Ford Ranger (8521), Mitsubishi Triton (6733)

Brand sales over Q1, 2019
| Brand | Sales | +/- % |
| Toyota | 49,618 | -5.4% |
| Mazda | 28,343 | -4.7% |
| Mitsubishi | 25,299 | 19.3% |
| Hyundai | 20,365 | -13.6% |
| Ford | 16,259 | -11.6% |
| Kia | 14,810 | 3.7% |
| Nissan | 12,841 | -18.5% |
| Volkswagen | 12,366 | -10.3% |
| Honda | 12,242 | -19.1% |
| Holden | 11,825 | -23.8% |
| Mercedes-Benz | 9255 | -9.6% |
| Subaru | 8489 | -36.4% |
| BMW | 6025 | -5.1% |
| Isuzu Ute | 5670 | -4.4% |
| Suzuki | 4634 | -5.6% |
| Audi | 3898 | -25.8% |
| Land Rover | 2492 | -17.4% |
| Lexus | 2259 | 2.9% |
| Renault | 2021 | -19.4% |
| Volvo Car | 1813 | 38.8% |
| MG | 1716 | 581.0% |
| Skoda | 1434 | 22.4% |
| Jeep | 1313 | -28.3% |
| LDV | 1307 | 4.0% |
| Porsche | 1034 | -23.0% |
Model sales over Q1, 2019:
| Model | Sales | +/- % |
| Toyota HiLux | 12,909 | 2.1% |
| Ford Ranger | 9662 | -9.7% |
| Mazda 3 | 8128 | -8.8% |
| Mitsubishi Triton | 7,518 | 13.1% |
| Mazda CX-5 | 7118 | 7.8% |
| Toyota Corolla | 6986 | -24.6% |
| Hyundai i30 | 6222 | -7.8% |
| Mitsubishi ASX | 6176 | 50.2% |
| Mitsubishi Outlander | 4905 | 22.8% |
| Kia Cerato | 4867 | 6.2% |
| Toyota RAV4 | 4855 | -12.9% |
| Nissan X-Trail | 4800 | -17.2% |
| Toyota Prado | 4584 | 10.0% |
| Holden Colorado | 4576 | 14.4% |
| Hyundai Tucson | 3964 | -14.3% |
| Toyota Camry | 3791 | 6.8% |
| Volkswagen Golf | 3745 | -23.3% |
| Mazda CX-3 | 3727 | -17.2% |
| Nissan Navara | 3709 | -31.9% |
| Isuzu D-Max | 3700 | -6.8% |
| Honda CR-V | 3680 | -18.9% |
| Kia Sportage | 3465 | 0.8% |
| Hyundai Accent | 3409 | -23.0% |
| Honda HR-V | 3259 | -0.5% |
| Mazda BT-50 | 3250 | -4.8% |
Any questions? Ask us in the comments and we’ll answer when we have time.
MORE: New car sales news coverage
[bsa_pro_ad_space id=15]